Unilever Gains Visibility & Control Over the Most Unpredictable Spend Category

Customer Profile
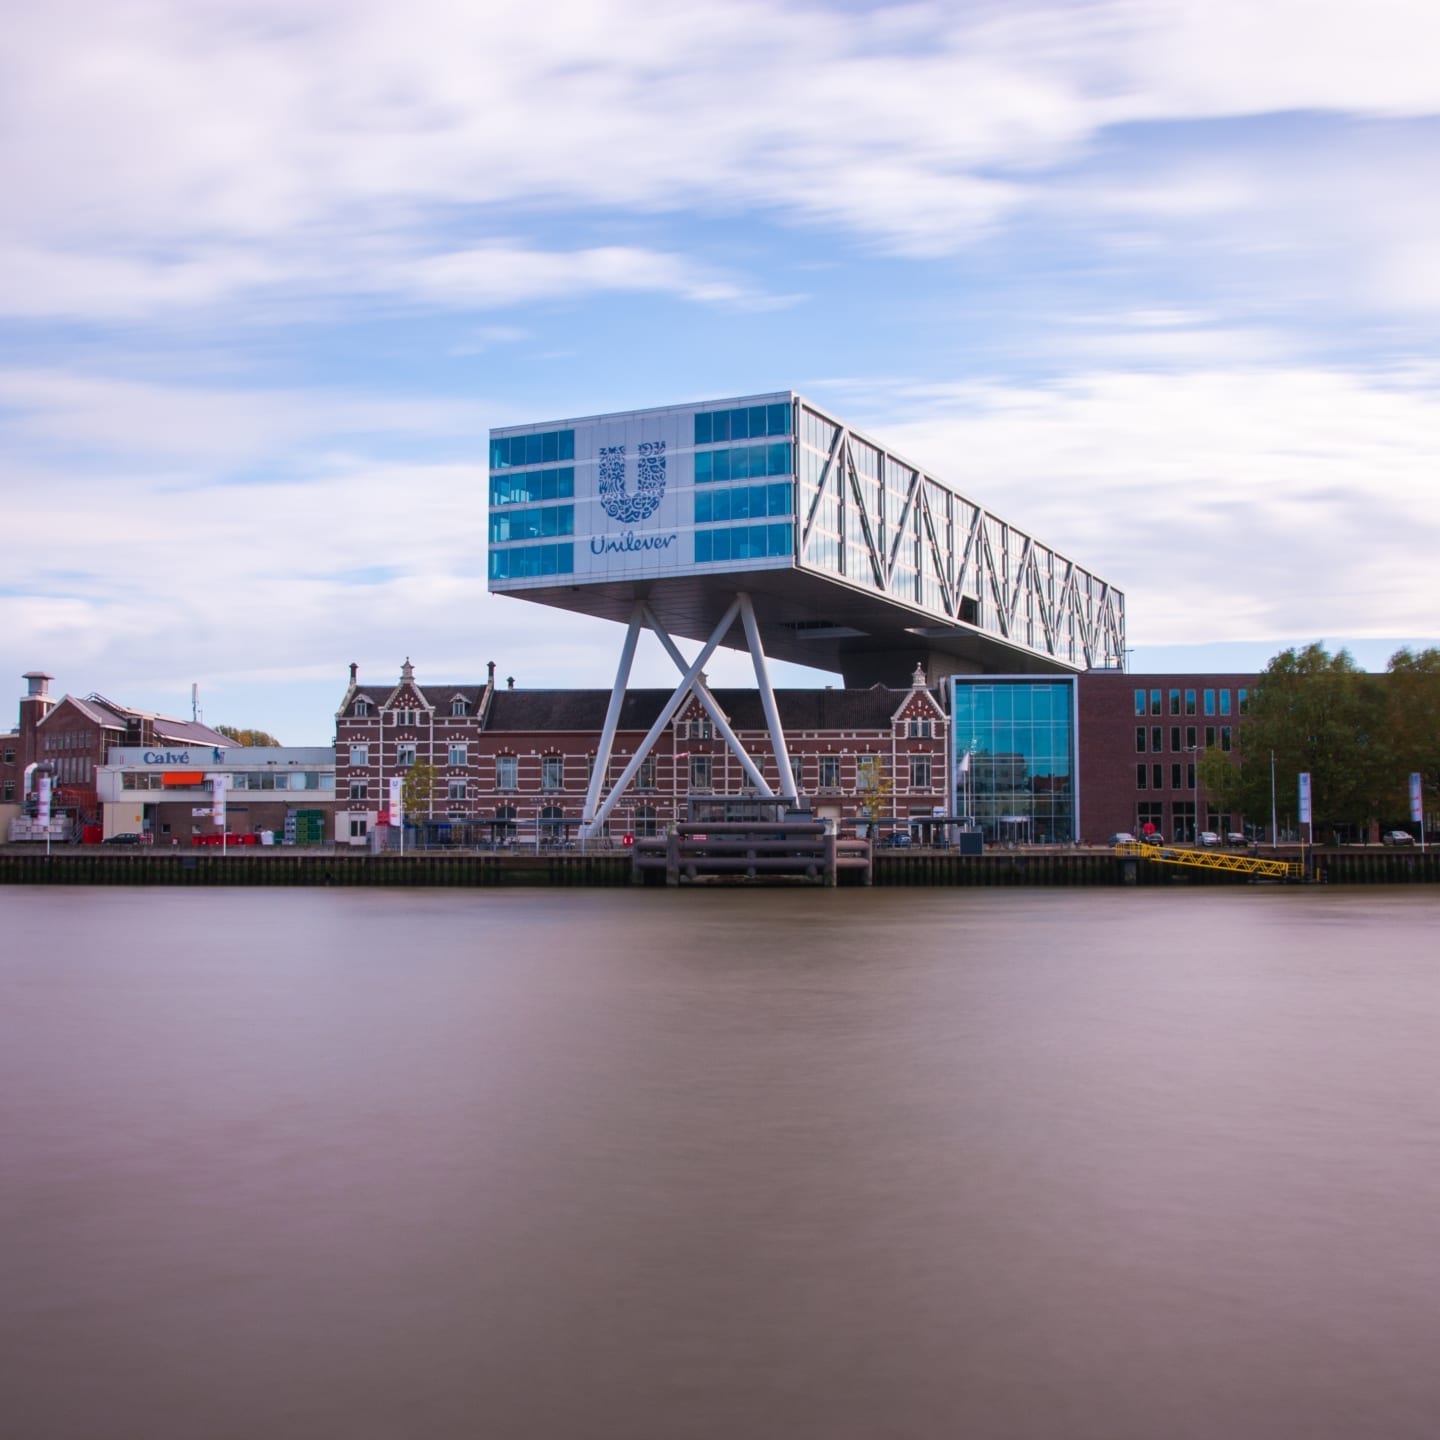
Every day, 2.5 billion people use Unilever products to feel good, look good and get more out of life. With more than 400 brands bought in 190 countries, Unilever delivered revenues of € 53.7 billion in 2017. Thirteen of its brands generate sales of over one billion euros. With headquarters in London and Rotterdam, the company has a single board of directors and four major divisions: Foods, Refreshment (beverages and ice cream), Home Care, and Beauty & Personal Care. Unilever has research and development facilities in China, India, the Netherlands, United Kingdom and United States and does 57 percent of its business in emerging markets.
Challenges
Unilever’s relationship with JAGGAER goes all the way back to 1998 with what was then Unilever’s Transportation Business Center (TBC) in North America. Over time, this engagement has expanded globally and is still focused on one of the most testing categories
of sourcing and contract management within procurement: transport and logistics. In recent years JAGGAER has conducted various guided sourcing events with Unilever, including one for refrigerated shipments of ice cream in North America, which netted eight-figure savings.
Contracts are very dynamic in this category, because there are so many moving parts. “A snapshot taken today of last year may shift greatly, going into the next year. This needs to be considered when modeling awards. Furthermore, as there are carrier capacity limitations and tendering complexities, it’s crucial to account for split lane scenarios and primary-backup relationships,” explains William Robinson, Engagement Manager at JAGGAER. “So, there is constant and progressive evolution for dynamic categories, such as transportation, which makes tracking usage and compliance over time with the dashboards so meaningful for these categories that are otherwise extremely difficult to get your arms around,” he adds.
The Solution
Claire Blake, Team Lead, Professional Services EMEA further explains why JAGGAER was uniquely placed to meet Unilever’s requirements: “Unilever’s Logistics Business Center, which is powered by a series of modules under the JAGGAER ONE umbrella, can offer customers transport category-specific suites covering precise end-to-end needs for advanced sourcing, contracts and rate management, complex matrix approvals processes, workflow compliance and so on, plus the inbound and outbound integrations. We can build scalable and robust analytics solutions, test them and roll them out across multiple geographies relatively quickly.”
Building Robust Analytics Dashboards
In 2019 the company decided to embark on a project to implement global dashboards for sourcing and contracting events. These should provide end users with visibility across their assigned scope. With multiple business teams working across the globe, the TBC is a source of integrated tendering and payment information, which provided a solid basis for constructing an analytics solution. Nonetheless, the way that data is captured in the many regions and countries differs somewhat, so this posed an integration challenge.
All the contract information and actuals in the Unilever TBC’s JCS database, information from the payment system, plus information generated by workflows and approvals matrices in JAGGAER Sourcing and Contracts modules, are integrated into the JAGGAER analytics dashboards. The reports are then presented in Tableau.
The dashboards, which have been implemented with JAGGAER Spend Analytics, are designed to answer a range of questions, guiding the end user through a journey of essential understanding of data in various functional areas. The dashboards are global in scope, covering all regions outside of Europe, with users able to get a quick overview and then drill down quickly into particular areas of interest such as by team, cluster, portfolio, market and modes (including air, intermodal, less than truckload, ocean, rail, truckload and warehousing).
The Sourcing dashboards address any queries regarding Unilever’s sourcing activities, providing a wealth of actionable information and insight on supplies and supplier engagement activities such as RFIs, RFPs and auctions, going way beyond standard visibility views, into detailed analytical snapshots such as variances and which processes and activities could be further optimized. They are primarily concerned with answering visibility questions such as:
- What is the total number of RFQs that have been completed?
- How many events (RFQs) have been run per division/location/category/event/round?
- What is the average number of scenarios in an RFQ?
- Are new suppliers being recommended to receive business?
Contract managers and administrators at Unilever are now able to leverage useful information to support their strategic sourcing activities, such as pipeline planning, and to help formulate bid strategies to maximize category savings. An end user can find answers to fundamental questions such as the total number of events, the number of suppliers and supplier participation. This can be done at a glance using standard screens and reports, such as the activity dashboard, events overview and adoption report.
A Goldmine of Information
“As users dig deeper into this goldmine of information, they can build a greater understanding and get fresh insights into what is working well, and what not so well, enabling them to devise remedial strategies and actions based on fact-based insights,” says Srestha Dutta, Global Process & Technology Senior Manager.
The contracts and contracts utilization dashboards provide a series of reports on the number of contracts portioned by different dimensions. The principle benefit is that they enable contract managers and administrators to identify the contracts that are not being optimally utilized and the suppliers associated with them. Again, this means they can take action based on solid information. The kind of questions primarily addressed here include, for example, what is the contract approval or turnaround time? How many contracts are expiring in the near term and in what categories? What is the distribution of contract utilization to the nearest 10 percent? What is the contract value for each of these 10 percent contract utilization bandings? And how does contract utilization vary with contract value? What is the contract utilization by category for the top ten categories (or suppliers)?
With answers to these and similar questions, the user can then drill down to the contracts and suppliers that need some kind of remedial action, for example due to under or over-utilization of a contract with a certain supplier on a specific route. Here too, multidimensional analytics enables Unilever users to filter data across various areas of interest. “The beauty of the system is that you can do all this quickly and easily, either by clicking on a chart in the dashboard or by using the inbuilt filter options in the dashboard header at the top of each dashboard,” says Srestha Dutta.
The Future
A Stronger Hand for The Next Negotiation
“What’s really beneficial is that we get instant insight into actual versus planned across all of our contracts, is our spend with a particular carrier a lot more or a lot less?” adds Srestha Dutta. With this information, Unilever can reassess the relationship and be in a much better position to negotiate next time round. The dashboard will help uncover other issues such as areas where there is excessive supplier fragmentation, identifying opportunities for more consolidation.
“In the transportation and logistics category there are infinite variables and unpredictable circumstances. Therefore, the ability to identify where contract management is going as planned, or conversely, where it is going off track due to under or over-utilization is a real asset. We foresee that the JAGGAER dashboards will bring many benefits for pipeline planning and bid strategies, enabling us to reverse savings erosion and get better value from our transport and logistics suppliers,” concludes Srestha Dutta.
Find out more about JAGGAER’s Solutions.
CPG
Flexible, tailored procurement solutions that support fast-moving supply chains.
Transportation & Logistics
Manage your carriers, negotiate the best value for service and tackle complex sourcing events.

Spend Analytics
Smart automation classifies and normalizes disparate data with a global view of all spend.


Contracts
Contract-compliant purchasing guides the buyer to the right supplier, price and terms.
